

『Coriolis Flow Meter Animation: Visual Overviews of Oscillating Deflection Theory』Related information(v cone flow meter|rotary gas meter|gallon meter|gear meter|metal tube rotameter|glass tube rotameter|nutating disk meter|transit time ultrasonic flow meter|wedge flow meter|pd meters|hydraulic flow meter|ultrasonic water flow meter|water flow meter|air flow meter|magnetic water flow meter|oxygen flow meter|gas flow meter|argon flow meter|air velocity meter|gasoline flow meter|fuel flow meter|ultrasonic water meter|digital water meter|nitrogen flow meter|solid flow meter|Oxygen tank flow meter|digital water flow meter|diesel fuel flow meter|steam flow meter|02 flow meter|compressed air flow meter|oil flow meter|liquid flow meter)
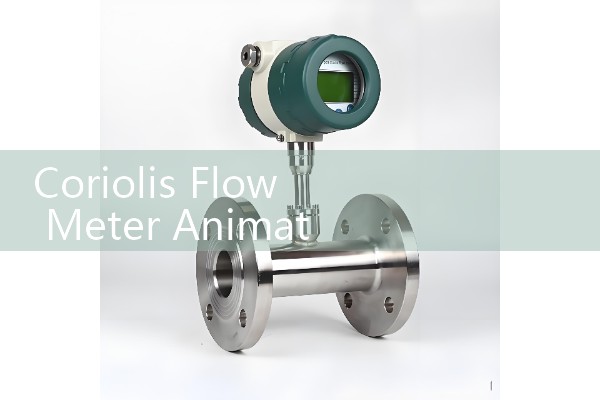
Coriolis Flow Meter Animation: Visual Overviews of Oscillating Deflection Theory
Quick Answer: A Coriolis flow meter animation shows why two vibrating tubes deflect when mass flow passes through them. The deflection creates a phase shift between the inlet and outlet sensors, and that phase shift is proportional to mass flow rate. Silver Automation Instruments uses the same visual model to explain sizing, sensor options, and trouble points for industrial buyers.
What the Animation Actually Shows
The animation usually begins with two parallel metal tubes at rest. Then a drive coil excites the tubes at their natural frequency. On a DN25 model this can be 90 Hz to 130 Hz depending on the tube material and wall thickness. With no flow, the tubes move in a symmetrical up and down cycle.
When flow begins, the visual adds a second motion. The fluid mass resists the tube vibration. The fluid inertia forces a small twist near the sensor positions. A real meter may show only a few micrometres of deflection at full flow. The animation exaggerates this movement so the phase shift becomes visible to the human eye.
Oscillating Deflection Theory Without the Heavy Math
Oscillating deflection theory describes this tube twist in mechanical terms. The drive coil pushes the tubes to vibrate at resonance. The fluid inside does not only travel forward. It also moves up and down with the tube. Because the fluid has mass, it pushes back against that vertical motion. The mass reaction causes the inlet leg and outlet leg to bend slightly out of sync.
The phase difference between the two sensor signals is directly proportional to mass flow rate. That is why a Coriolis flow meter reads mass flow directly. There is no need for separate pressure compensation or temperature compensation for a standard mass flow measurement. The animation shows the inlet leg bending a moment before the outlet leg, so the timing shift becomes easy to grasp.
Why Engineers Watch These Animations Before Buying
Most engineers skip this part. But a quick visual overview can prevent installation mistakes. A paint manufacturer in Indonesia contacted us after watching a Coriolis flow meter animation. They needed ten units for solvent batching. Their team wanted to know if the meter would stay stable at viscosities up to 500 cP. The visual helped them understand why a Coriolis meter can handle viscosity changes better than many other meter types.
We have seen the same training need on customer sites many times. A plant engineer uses the animation to explain the meter to an operator who only sees a pipe and a transmitter. The operator then understands why two-phase flow makes the reading noisy and why the meter needs a short warm up period before stable output.
Animation Features That Match Silver Instruments Coriolis Meters
Silver Instruments supplies Coriolis mass flow meters from DN15 to DN200. The visual features to compare include tube shape, drive frequency, sensor pickup points, and transmitter damping. A standard meter has accuracy of 0.1 percent of reading for liquid and gas mass flow. Output options include 4-20 mA HART, pulse, and RS485 Modbus. Some models meet ATEX Zone 1 requirements for hazardous area use.
For a DN15 model, typical liquid mass flow range can start from 0 to 1000 kg/h. A DN50 model can handle 0 to 50000 kg/h depending on fluid density and line pressure. The animation ex
Common Misunderstandings About the Deflection Visual
Here is the thing. One common error is thinking that a larger visible deflection means better accuracy. In most well-designed meters the opposite is true. The deflection is very small. The sensor coil and transmitter signal processing matter more for repeatability. A good animation will often show the deflection enlarged for teaching purposes, but that does not mean the real tube motion is large.
Another error is treating the animation as a scale model. If the visual showed true scale, the deflection would be impossible to see. The animation is a timing and motion aid. It keeps the phase relationship accurate while making the twist visible.
How to Use This Visual Overview for Your Own Application
Start with the fluid type. A Coriolis flow meter measures mass flow directly for liquids, gases, and slurries. The visual model matters less for a plain water line than for a food and beverage batch process. A dairy plant in Mexico used a Silver Instruments Coriolis meter for syrup dosing at 1200 kg/h. The animation helped their team see why the meter should not sit at the lowest point of the line without drainage and clean-in-place access.
Next define your pipe size, flow range, and process pressure. Then choose the output signal. Most plants in Southeast Asia and the Middle East ask for 4-20 mA HART because that signal drops into existing PLC systems. For longer distance monitoring, RS485 Modbus is common. Silver Instruments can supply either option.
FAQ: Key Questions on Coriolis Flow Meter Animation and Operation
What does the phase shift in a Coriolis flow meter animation represent?
The phase shift is the time difference between the inlet sensor signal and the outlet sensor signal. It is proportional to mass flow rate.
Does more tube deflection mean higher accuracy?
No. High quality meters often work with very small deflection. Repeatability depends on the sensor design and the transmitter more than on visible deflection.
Which fluids can a Silver Instruments Coriolis meter measure?
Liquids, gases, slurries, and high viscosity fluids. Common examples include crude oil, palm oil, LNG, molasses, adhesives, and chemicals.
Do I need pressure and temperature compensation for mass flow?
For direct mass flow, no. The meter measures mass flow directly. Pressure and temperature data are still useful for density reference conditions in some applications.
How do I get a quote with the right model?
Send us your fluid type, flow range, pipe size (DN), process pressure (bar), temperature (°C), and output signal. Silver Instruments will reply with a recommended model and price.
Contact Silver Automation Instruments
For a Coriolis flow meter animation, technical drawing, or quote, contact Silver Automation Instruments. Reach us at Tel: +86-135-1213-1526, WhatsApp: 86-135-12131526, or WeChat: +86 13512131526. The website is flow-meter.com.au.
Tell us your fluid, flow range, pipe size, and process conditions. We will recommend a DN15 to DN200 Coriolis mass flow meter and send a price based on your requirements.
 Hot Blog
 Related AD